
ggplot2
☆☆☆☆☆
(0 opinii)
Najniższa cena (z dostawą)
25,18 CAD
Typowa cena560,41 PLN
Najniższa (90 dni)25,18 PLN
Liczba ofert3
Ostatnia aktualizacja1 dzień temu
Historia ceny (90 dni)
Pełna historia
2026-08-07
2026-08-08
| Zaktualizowano | Cena |
|---|---|
| 2026-08-07 | 25,18 |
| 2026-08-08 | 67,59 |
| Sprzedawca | Cena produktu | Dostawa | Razem | Dostępność | Aktualizacja | |
|---|---|---|---|---|---|---|
| VI VitalSource | 25,18 CAD | 0 zł | 25,18 CAD | Dostępny | 2 dni temu | Zobacz ofertę |
| SP Springer Nature Author | 9 294,00 JPY | 19,00 JPY | 9 313,00 JPY | Dostępny | 1 dzień temu | Zobacz ofertę |
| SP SpringerNatureLink Shop INT | 71,49 EUR | 0 zł | 71,49 EUR | Dostępny | 2 dni temu | Zobacz ofertę |
Ceny i dostępność mogą ulec zmianie. Ostatnia aktualizacja: 08.08.2026 21:18.
EAN
9783319242750
Springer Nature
0,0
☆☆☆☆☆
0 opinii
5★
0%
4★
0%
3★
0%
2★
0%
1★
0%
Opinie o produkcie
Brak opinii — bądź pierwszy!
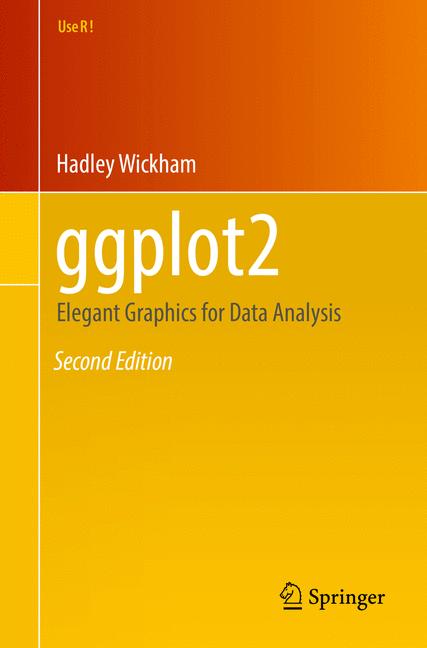
This new edition to the classic book by ggplot2 creator Hadley Wickham highlights compatibility with knitr and RStudio. ggplot2 is a data visualization package for R that helps users create data graphics, including those that are multi-layered, with ease. With ggplot2, it's easy to: produce handsome, publication-quality plots with automatic legends created from the plot specification superimpose multiple layers (points, lines, maps, tiles, box plots) from different data sources with automatically adjusted common scales add customizable smoothers that use powerful modeling capabilities of R, such as loess, linear models, generalized additive models, and robust regression save any ggplot2 plot (or part thereof) for later modification or reuse create custom themes that capture in-house or journal style requirements and that can easily be applied to multiple plots approach a graph from a visual perspective, thinking about how eachcomponent of the data is represented on the final plot This book will be useful to everyone who has struggled with displaying data in an informative and attractive way. Some basic knowledge of R is necessary (e.g., importing data into R). ggplot2 is a mini-language specifically tailored for producing graphics, and you'll learn everything you need in the book. After reading this book you'll be able to produce graphics customized precisely for your problems, and you'll find it easy to get graphics out of your head and on to the screen or page.