
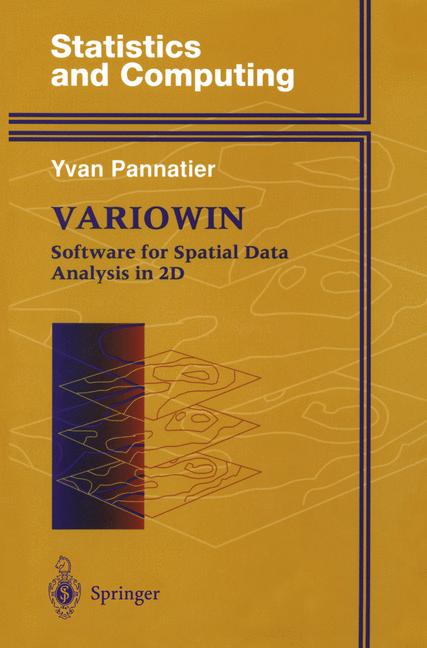
Variowin
☆☆☆☆☆
(0 reviews)
Lowest price (incl. delivery)
7 178,00 JPY
Typical price491,72 PLN
Lowest (90 days)44,99 PLN
Offers6
Last updated1주 전
Price history (90 days)
Full history
2026-08-08
2026-08-15
| 업데이트 일시 | 가격 |
|---|---|
| 2026-08-08 | 49,99 |
| 2026-08-14 | 44,99 |
| 2026-08-15 | 51,99 |
| 판매자 | Product price | Delivery | 합계 | 재고 여부 | Updated | |
|---|---|---|---|---|---|---|
| SP SpringerNatureLink Shop INT | 7 149,00 JPY | 29,00 JPY | 7 178,00 JPY | 구매 가능 | 2일 전 | View offer |
| SP Springer Nature Author | 7 149,00 JPY | 25,00 JPY | 7 174,00 JPY | 구매 가능 | 1주 전 | View offer |
| SP SpringerNatureLink Shop INT | 49,99 USD | free | 49,99 USD | 구매 가능 | 3일 전 | View offer |
| SP SpringerNatureLink Shop INT | 54,99 USD | 15,00 USD | 69,99 USD | 구매 가능 | 3일 전 | View offer |
| SP SpringerNatureLink Shop INT | 54,99 USD | free | 54,99 USD | 구매 가능 | 3일 전 | View offer |
| SP SpringerNatureLink Shop INT | 59,00 EUR | 29,00 EUR | 88,00 EUR | 구매 가능 | 3일 전 | View offer |
가격과 재고 여부는 변경될 수 있습니다. 마지막 업데이트: 08.08.2026 23:12.
0,0
☆☆☆☆☆
0 reviews
5★
0%
4★
0%
3★
0%
2★
0%
1★
0%
Product reviews
No reviews yet — be the first!
1.1 Overview V ARIOWIN 2.2 is a collection of four Windows™ programs - Prevar2D, Vari02D with PCF, Model, and Grid Display - that are used for spatial data analysis and variogram modeling of irregularly spaced data in two dimensions. Prevar2D builds a pair comparison file (PCF), that is, a binary file containing pairs of data sorted in terms of increasing distance. Pair comparison files can be built from subsets in order to reduce memory requirements. Vari02D with PCF is used for spatial data analysis of 2D data. It uses an ASCII data file and a binary pair comparison file produced by Prevar2D. Features implemented in Vari02D with PCF include: • the possibility to characterize the spatial continuity of one variable or the joined spatial continuity of two variables, • variogram surfaces for identifying directions of anisotropies, • directional variograms calculated along any direction, • several measures of spatial continuity. Not only the variogram but also the standardized variogram, the covariance, the correlogram, and the madogram are used to measure spatial continuity. • h-scatterplots to assess the meaning of these measures, • the identification and localization of pairs of data adversely affecting the measure of spatial continuity. Once identified, these pairs can be masked from the calculation interactively. • variogram clouds for identifying pairs of data values having the most influence on the measure of spatial continuity. Those pairs can also be located on the sample map.
Similar products
 50 Years of Philosophy and Medicine
from $107.30
50 Years of Philosophy and Medicine
from $107.30
 Understanding Cybersecurity Law and Digital Privacy
from $122.63
Understanding Cybersecurity Law and Digital Privacy
from $122.63
 Decisions in International Trade and Logistics
from $122.63
Decisions in International Trade and Logistics
from $122.63
 Advances in Economic Measurement
from $122.63
Advances in Economic Measurement
from $122.63
 Nanomaterials
from $137.96
Nanomaterials
from $137.96
 Sustainable Scaffolds-based Strategies in Tissue Engineering and Regenerative Medicine
from $162.87
Sustainable Scaffolds-based Strategies in Tissue Engineering and Regenerative Medicine
from $162.87
 Narratives in Educational Research
from $162.87
Narratives in Educational Research
from $162.87
 Environmental Biology of the Young Chinese Sturgeon
from $210.78
Environmental Biology of the Young Chinese Sturgeon
from $210.78