
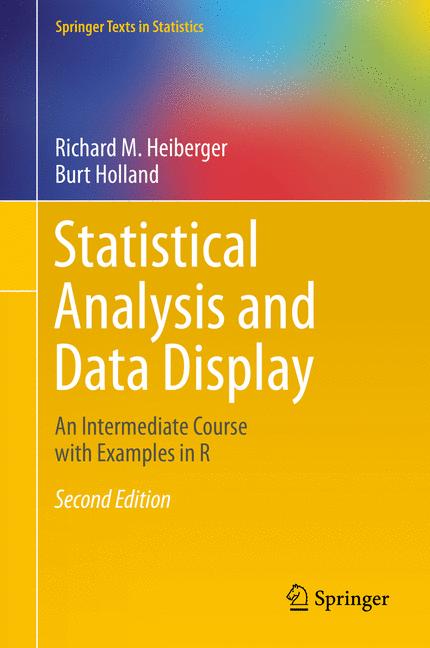
Statistical Analysis and Data Display
☆☆☆☆☆
(0 reviews)
Lowest price (incl. delivery)
137,50 EUR
Typical price101,25 PLN
Lowest (90 days)79,50 PLN
Offers2
Last updated1週間前
Price history (90 days)
Full history
2026-08-08
2026-08-15
| 更新日時 | 価格 |
|---|---|
| 2026-08-08 | 108,50 |
| 2026-08-15 | 79,50 |
| 販売者 | Product price | Delivery | 合計 | 在庫状況 | Updated | |
|---|---|---|---|---|---|---|
| SP SpringerNatureLink Shop INT | 108,50 EUR | 29,00 EUR | 137,50 EUR | 在庫あり | 6日前 | View offer |
| SP Springer Nature Author | 108,50 EUR | free | 108,50 EUR | 在庫あり | 1週間前 | View offer |
価格や在庫状況は変更される場合があります。 最終更新: 08.08.2026 21:37.
EAN
9781493921225
Springer Nature
0,0
☆☆☆☆☆
0 reviews
5★
0%
4★
0%
3★
0%
2★
0%
1★
0%
Product reviews
No reviews yet — be the first!
This contemporary presentation of statistical methods features extensive use of graphical displays for exploring data and for displaying the analysis. The authors demonstrate how to analyze data—showing code, graphics, and accompanying tabular listings—for all the methods they cover. Complete R scripts for all examples and figures are provided for readers to use as models for their own analyses. This book can serve as a standalone text for statistics majors at the master’s level and for other quantitatively oriented disciplines at the doctoral level, and as a reference book for researchers. Classical concepts and techniques are illustrated with a variety of case studies using both newer graphical tools and traditional tabular displays. New graphical material includes: an expanded chapter on graphics a section on graphing Likert Scale Data to build on the importance of rating scales in fields from population studies to psychometrics a discussion on design of graphics that will work for readers with color-deficient vision an expanded discussion on the design of multi-panel graphics expanded and new sections in the discrete bivariate statistics capter on the use of mosaic plots for contingency tables including the n×2×2 tables for which the Mantel–Haenszel–Cochran test is appropriate an interactive (using the shiny package) presentation of the graphics for the normal and t-tables that is introduced early and used in many chapters
Similar products
 50 Years of Philosophy and Medicine
from $107.30
50 Years of Philosophy and Medicine
from $107.30
 Understanding Cybersecurity Law and Digital Privacy
from $122.63
Understanding Cybersecurity Law and Digital Privacy
from $122.63
 Decisions in International Trade and Logistics
from $122.63
Decisions in International Trade and Logistics
from $122.63
 Advances in Economic Measurement
from $122.63
Advances in Economic Measurement
from $122.63
 Nanomaterials
from $137.96
Nanomaterials
from $137.96
 Sustainable Scaffolds-based Strategies in Tissue Engineering and Regenerative Medicine
from $162.87
Sustainable Scaffolds-based Strategies in Tissue Engineering and Regenerative Medicine
from $162.87
 Narratives in Educational Research
from $162.87
Narratives in Educational Research
from $162.87
 Environmental Biology of the Young Chinese Sturgeon
from $210.78
Environmental Biology of the Young Chinese Sturgeon
from $210.78