
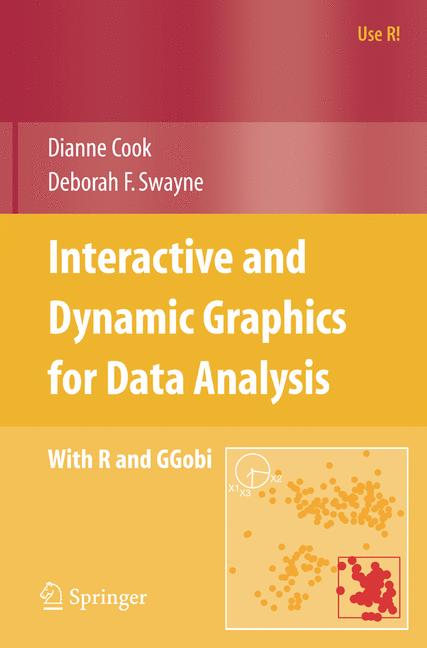
Interactive and Dynamic Graphics for Data Analysis
☆☆☆☆☆
(0 reviews)
Lowest price (incl. delivery)
7 174,00 JPY
Typical price525,30 PLN
Lowest (90 days)35,99 PLN
Offers6
Last updatedpřed 1 týdnem
Price history (90 days)
Full history
2026-08-08
2026-08-15
| Aktualizováno | Cena |
|---|---|
| 2026-08-08 | 39,99 |
| 2026-08-14 | 35,99 |
| 2026-08-15 | 52,74 |
| Prodejce | Product price | Delivery | Celkem | Dostupnost | Updated | |
|---|---|---|---|---|---|---|
| SP SpringerNatureLink Shop INT | 7 149,00 JPY | 25,00 JPY | 7 174,00 JPY | Dostupné | před 5 dny | View offer |
| SP Springer Nature Author | 7 149,00 JPY | 25,00 JPY | 7 174,00 JPY | Dostupné | před 1 týdnem | View offer |
| SP SpringerNatureLink Shop INT | 49,99 USD | 25,00 USD | 74,99 USD | Dostupné | před 6 dny | View offer |
| SP SpringerNatureLink Shop INT | 54,99 USD | free | 54,99 USD | Dostupné | před 6 dny | View offer |
| SP SpringerNatureLink Shop INT | 54,99 USD | free | 54,99 USD | Dostupné | před 6 dny | View offer |
| SP SpringerNatureLink Shop INT | 59,00 EUR | free | 59,00 EUR | Dostupné | před 6 dny | View offer |
Ceny a dostupnost se mohou změnit. Naposledy aktualizováno: 08.08.2026 23:08.
0,0
☆☆☆☆☆
0 reviews
5★
0%
4★
0%
3★
0%
2★
0%
1★
0%
Product reviews
No reviews yet — be the first!
This book is about using interactive and dynamic plots on a computer screen as part of data exploration and modeling, both alone and as a partner with static graphics and non-graphical computational methods. The area of int- active and dynamic data visualization emerged within statistics as part of research on exploratory data analysis in the late 1960s, and it remains an active subject of research today, as its use in practice continues to grow. It now makes substantial contributions within computer science as well, as part of the growing ?elds of information visualization and data mining, especially visual data mining. The material in this book includes: • An introduction to data visualization, explaining how it di?ers from other types of visualization. • Adescriptionofourtoolboxofinteractiveanddynamicgraphicalmethods. • An approach for exploring missing values in data. • An explanation of the use of these tools in cluster analysis and supervised classi?cation. • An overview of additional material available on the web. • A description of the data used in the analyses and exercises. The book’s examples use the software R and GGobi. R (Ihaka & Gent- man 1996, RDevelopment CoreTeam2006) isafreesoftware environment for statistical computing and graphics; it is most often used from the command line, provides a wide variety of statistical methods, and includes high–quality staticgraphics.RaroseintheStatisticsDepartmentoftheUniversityofAu- land and is now developed and maintained by a global collaborative e?ort.
Similar products
 50 Years of Philosophy and Medicine
from $107.30
50 Years of Philosophy and Medicine
from $107.30
 Understanding Cybersecurity Law and Digital Privacy
from $122.63
Understanding Cybersecurity Law and Digital Privacy
from $122.63
 Decisions in International Trade and Logistics
from $122.63
Decisions in International Trade and Logistics
from $122.63
 Advances in Economic Measurement
from $122.63
Advances in Economic Measurement
from $122.63
 Nanomaterials
from $137.96
Nanomaterials
from $137.96
 Sustainable Scaffolds-based Strategies in Tissue Engineering and Regenerative Medicine
from $162.87
Sustainable Scaffolds-based Strategies in Tissue Engineering and Regenerative Medicine
from $162.87
 Narratives in Educational Research
from $162.87
Narratives in Educational Research
from $162.87
 Environmental Biology of the Young Chinese Sturgeon
from $210.78
Environmental Biology of the Young Chinese Sturgeon
from $210.78